This week, some of our ākonga brought in a swan plant. It was very special because not only did it have a baby caterpillar on it but it had a chrysalis with a monarch butterfly ready to emerge.
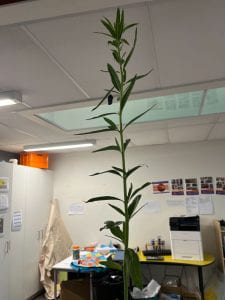
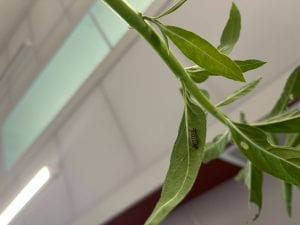
We checked in on the chrysalis throughout the day on Wednesday, but it didn’t change. We could see the butterfly through the chrysalis, and it looked really dark. The ākonga took the swan plant home on Wednesday for the night.
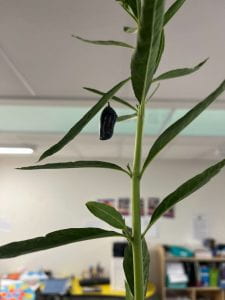
On Thursday, the ākonga brought a newly emerged monarch butterfly to school. How exciting! The butterfly was still sitting close to the chrysalis and wasn’t moving very much. It had come out of its chrysalis overnight. In the afternoon, we got to watch some videos of it happening.
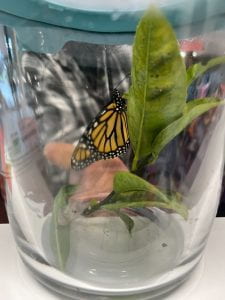
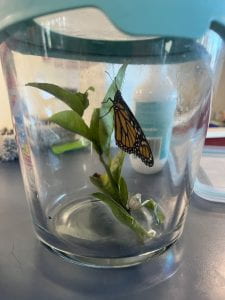
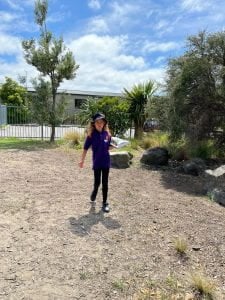
On Friday, the Butterfly returned to school. It was moving more within the container, and we were told it was ready to release. Just before we went home for the weekend, the year 3s went outside, the butterfly was already flapping its wings inside the container. Then, one of the ākonga took the lid off, and we waved goodbye as it flew away on its new adventure. What an incredible experience to celebrate together!

